Your Portfolio Holds 8 Stocks and You Read the Whole Market's News — Fund-Desk Portfolio Surveillance, in One Click
Funds do not chase every headline. They fence the watchlist first, then scan only the names on their own list. This walks through uploading your portfolio Excel file into the Terminal (up to 50 names), asking one question in Thai, and getting the management discussion and analysis (MD&A) of every holding laid side by side — plus three live watchlists quoting Form 56-1 (One Report) word for word with source links to check, and API code for teams that want to run it as a pipeline.
Your Portfolio Holds 8 Stocks and You Read the Whole Market's News — Fund-Desk Portfolio Surveillance, in One Click
Funds do not chase every headline. They fence the watchlist first, then scan only the names on their own list. This walks through uploading your portfolio Excel file into the Terminal (up to 50 names), asking one question in Thai, and getting the management discussion and analysis (MD&A) of every holding laid side by side — plus three live watchlists quoting Form 56-1 (One Report) word for word with source links to check, and API code for teams that want to run it as a pipeline.
One morning you open your phone to 40 stock headlines. You read for 20 minutes, close the screen, and feel "caught up."
Ask yourself the blunt version: of those 40 headlines, how many were about a stock you actually own — not the name everyone is talking about, not the one a friend asked about, but the 8 positions with your money in them.
For most people the answer is zero to one.
That is one of the widest gaps between retail and people who read filings for a living, and it has nothing to do with intelligence or private information — it is scoping. The institutional side never starts from news. It starts from a list, every time: the analyst's coverage universe · the portfolio manager's watchlist · the credit desk's borrower book. Fence the universe first, then scan for signal inside the fence.
Here is how you run the same process with no data team and no code — you take the Excel portfolio file you already have and throw it in.
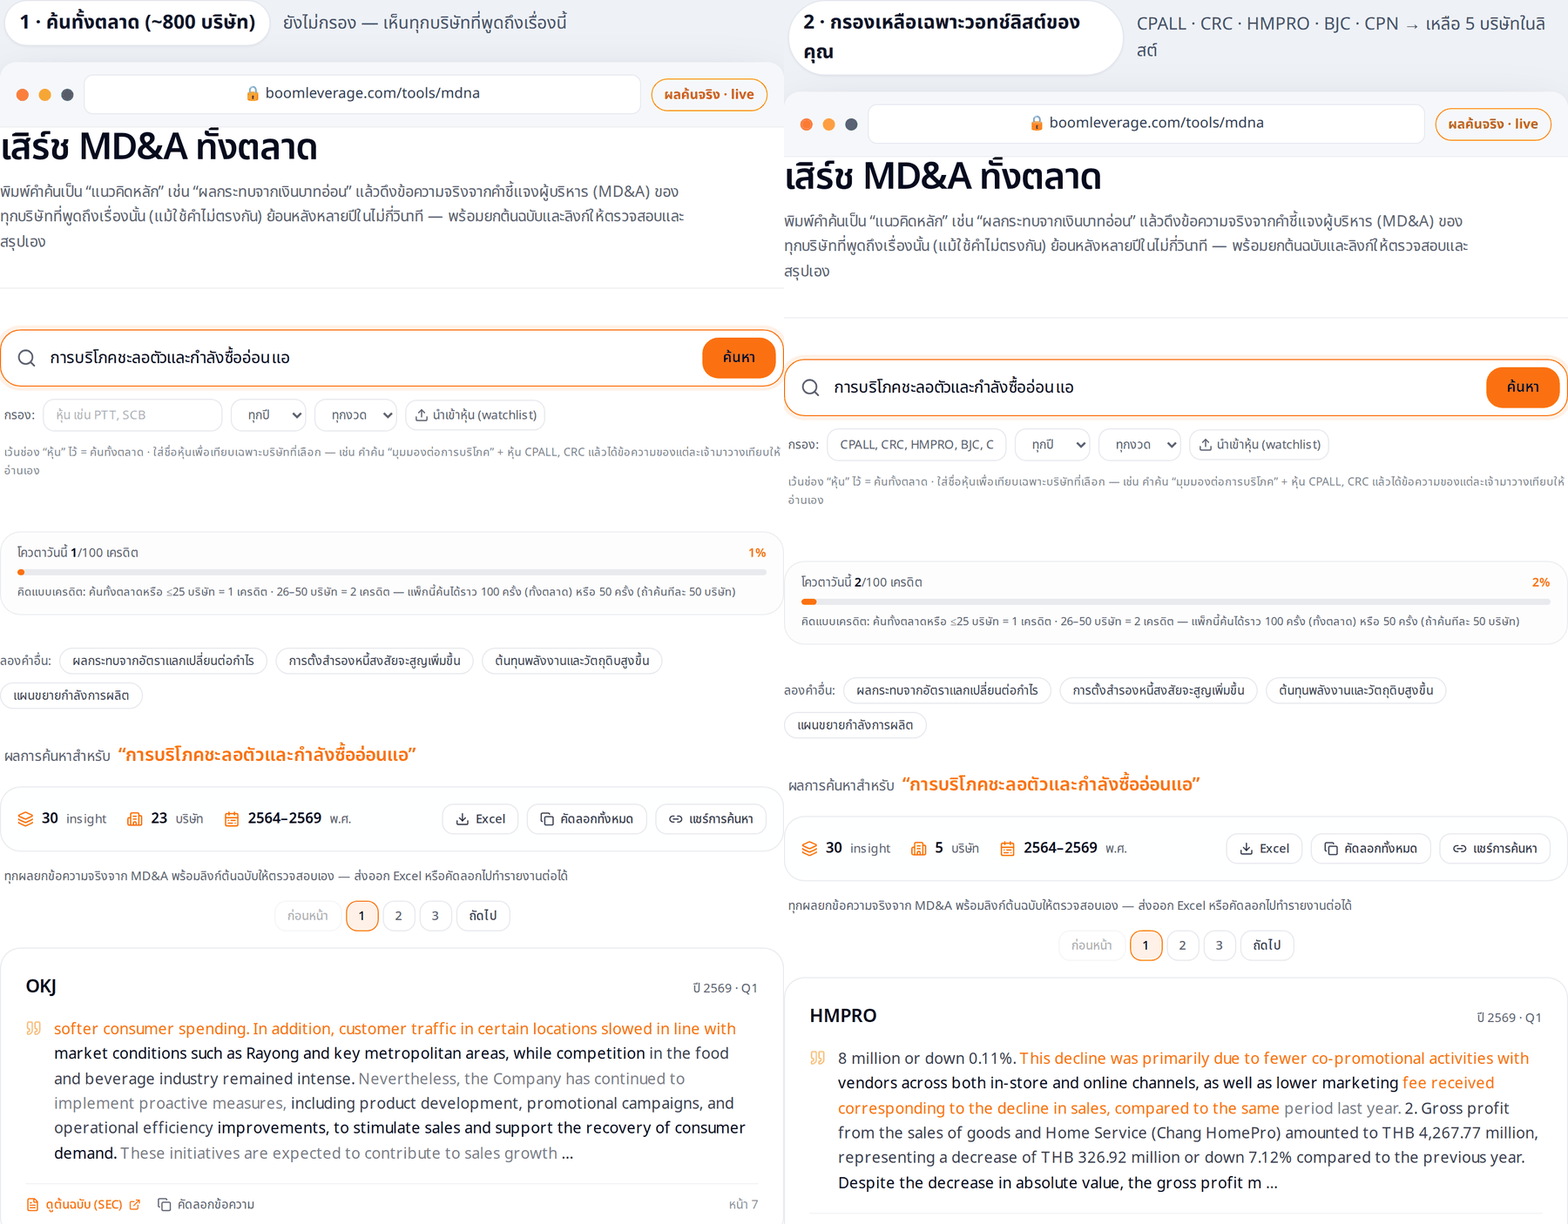
Before and after the filter (live UI, not a mock-up): one concept, "การบริโภคชะลอตัว" [households pulling their spend in] — searched market-wide it returns 23 companies; drop in the CPALL · CRC · HMPRO · BJC · CPN watchlist and it collapses to the 5 names on the list on the spot (watch the "companies" count and the result names change). Every card quotes the source text and links the 56-1 so you can check it.
1. Noise vs. focus: the table that explains why reading more leaves you further behind
I worked model risk inside a bank for years, and the clearest thing about watching institutional people work is this: they read a fraction of what retail reads and know far more. They are not competing on volume. They compete on reading the right names.
| Retail, mostly (noise) | The institutional side (focus) | |
|---|---|---|
| Starting point | whatever news or posts drift past | the list of names they answer for |
| Scope | the entire market plus whatever is hot | a fenced universe, ~20–50 names |
| Source | headlines · other people's opinions | primary documents (56-1 / MD&A) |
| Cadence | every time a headline pops | on a cycle — every quarter, when filings land |
| Question asked | "what looks buyable today" | "the names I hold — has management's tone shifted" |
| Result | broad, shallow on every name | deep on exactly the names holding money |
Look hard at the last row. Shotgun reading does not just burn time. It leaves you with an opinion on the whole market and no depth on the stocks you own — the only group your P&L is actually tied to.
And the thing that tells you best whether the tone shifted is not news. It is the MD&A (management discussion and analysis) inside Form 56-1 (One Report), which management has to write themselves every quarter. The document is free and anyone can download it, and almost no retail investor reads it across a whole portfolio, because it runs long and sits in separate files. (If you have never opened one, I took the structure apart in reading One Report / 56-1 properly)
Why this matters to us: fencing a watchlist is not going blind on the market. It is spending the limited time you have on the names you have to make a decision about — add, hold, or cut. The rest of the market is still searchable the day you go looking for something new.
2. Two architectures: the one funds build, and the one I already wired a button to
Institutional-style portfolio surveillance runs on one mechanism: put your own list into the search system first, then ask the question. The only difference is who has to hire people to build it.
Option 1 — the institutional build (you need someone who writes code)

   coverage.csv  (200 names)
        │
        ▼
   Data engineer writes a script ── chunk into 50s ──┐
        │                                            │
        ▼                                            ▼
   Loop the REST API per chunk  ──────────────────►  Merge results → write out to Excel
        │
        ▼
   Cron it every morning → drop it into the team's shared sheet
   Cost: an engineer's salary + someone to babysit the pipeline


Option 2 — your build (not one line of code)

   Your portfolio file in Excel  (8 names)
        │   Save As → .csv   (or just paste the ticker column, that works too)
        ▼
   The “นำเข้าหุ้น (watchlist)” [Import stocks] button on the Terminal
        │
        ▼
   One line of Thai in the question box
        │
        ▼
   Every holding's MD&A, side by side + 56-1 links to check
   Cost: 1 credit (portfolio ≤25 names) out of the free 100 credits/day
Both paths end at the same output. The only question is who assembles the plumbing — and the right-hand plumbing is already assembled. You throw in the file.
3. Method 1, hands on: type your holdings into the filter field
On the tool page, under the main search box, there is a "กรอง:" [Filter:] row with a field for tickers. Type or paste the names separated by spaces or commas — PTT, SCB, KBANK, for instance — then put what you want to know into the main box. Results squeeze down to those names only. Leave the field empty and you are searching the whole market as before.
The part to understand: the search is still semantic. The filter narrows the company scope; it does not switch the engine over to exact-match. You can still type "การบริโภคชะลอตัว" [demand is rolling over at the till] and land on a company that wrote "cautious consumer spending" — different words, different language. (Why that works: how semantic search differs from exact keyword matching)
On the web you type, you do not code. To show what the filter is doing underneath, here is the concept in code (the API for teams and enterprises is in the beta plan — see section 8):
# ตัวอย่างเชิงแนวคิด — บนหน้าเว็บพิมพ์ในช่องได้เลย
from boomleverage import mdna

hits = mdna.search(
    "การบริโภคชะลอตัว",                     # แนวคิด (semantic)
    tickers=["CPALL", "CRC", "HMPRO", "BJC", "CPN"],  # กรองเฉพาะลิสต์คุณ
    top_k=10,
)
for r in hits["results"]:
    print(r["ticker"], f"ปี {r['fy']}", r["period"])
    print(r["snippet_verbatim"])   # ข้อความจริงจาก MD&A (verbatim)
    print(r["source_url"])         # ลิงก์ไฟล์ 56-1 ต้นฉบับ ก.ล.ต.
A limit that is there on purpose: you can filter up to 50 names per query — enough for almost any retail portfolio, and for most analysts' coverage too, but it stops anyone from filtering "the whole market" in one shot to hoover the corpus out. Go over and the system takes the first 50 and tells you straight where it cut.
Credits, before you click: searching the whole market or picking ≤25 companies = 1 credit · every additional 25 names = +1 credit (50 names = 2 credits). So a normal retail portfolio of 8–25 names scans 100 questions a day on the free pack, no card attached.
4. Method 2, hands on: throw your portfolio Excel file straight in
If your portfolio already lives in Excel — the file where you track cost basis, share count, P&L — do not retype it name by name. Hit "นำเข้าหุ้น (watchlist)" [Import stocks (watchlist)] and upload the CSV. The system reads the first column of each row as the ticker, which is the standard shape of nearly every watchlist export out there. So a file like this works immediately:
Symbol
PTT
AOT
CPALL
The import box has a ดาวน์โหลดเทมเพลต [Download template] button (mdna-watchlist-template.csv) carrying the Symbol header already — open it in Excel or Google Sheets, drop your holdings into the first column, save as .csv, upload it back. Three steps.
From actual portfolio files: most have several columns (ticker · quantity · cost · value…). Just make the ticker column the first column, then Save As → CSV. Only the first column gets used. The rest is untouched, and it goes nowhere.
Too lazy to save a file: copy the ticker column out of Excel and paste it straight into the import box. The system splits on line breaks, commas and tabs and pulls the tickers out (the field takes
.csv/.txtfiles and hand-pasted text alike).
Stack year and period filters on top of that
Beyond the company filter there are fiscal year and period (Q1–Q4 / full year) filters to narrow further. Three layers stacked is how you land on the exact window you suspect, on the exact names you hold:
Query: "การตั้งสำรองหนี้เพิ่มขึ้น" [they are provisioning harder]
   └─ Layer 1 · stocks  →  BBL, KBANK, SCB, KTB, TTB   (your bank sleeve)
        └─ Layer 2 · year  →  FY2022                   (the year you suspect)
             └─ Layer 3 · period  →  Q2                (the quarter the numbers went odd)
                  ⇒ what survives is the handful of paragraphs that answer you
What it digs through: the management discussion and analysis of 926 Thai listed companies, FY2021–FY2026, roughly 700,237 text chunks, already converted into semantic coordinates ahead of time. Your remaining job is deciding what to ask.
5. Three live watchlists — different list, different question
Every result below came out of the live system, quoted word for word from Form 56-1 (One Report) with a link to check the source yourself. I picked the three that map closest to a Thai retail portfolio.
Retail and consumer watchlist → ask "การบริโภคชะลอตัว" [demand rolling over at the till]
Filter to CPALL, CRC, HMPRO, BJC, CPN and ask about purchasing power. The system pulls the passages where management writes about consumers holding back and lays them side by side across issuers — HMPRO and CRC here:
HMPRO · FY2021 (Q3): "...sales was affected by the temporary stores closure by the order of the Center for COVID-19 Situation Administration (CCSA) and lower consumer purchasing power along with declining of economic situation... the government has relaxed the lockdown measure but the consumer purchasing power has not fully recovered yet..."
CRC · FY2023 (Q3): "...cautious in spending amid the economic slowdowns. However, it met customer needs through Omnichannel platforms, the revenue of which was consistently generated, increasing 9% from the previous year..."
— partial text (verbatim) from the MD&A · check the source: HMPRO 56-1 · CRC 56-1
This is what shotgun news reading cannot hand you: both are taking the same demand headwind and they write about it in completely different postures — one says purchasing power has not recovered, the other says customers are cautious but it offset through Omnichannel and revenue still grew 9%. That split in posture is one click away the moment you put them in the same list.
Export and electronics watchlist → ask "เงินบาทกระทบกำไร" [the currency is coming out of the margin]
Filter to KCE, HANA, DELTA, IVL, PTT and ask about the exchange rate — built for anyone holding exporters whose earnings swing with the currency:
HANA · FY2022 (full year): "...purchasing currency which is primarily USD and the operating currency in each country which we operate..." (management spells out the buy-and-sell currency structure that drives the FX exposure directly)
— verbatim from HANA's MD&A · source file at the SEC (Thailand's Securities and Exchange Commission)
Bank watchlist (the dividend-portfolio staple) → ask "การตั้งสำรองผลขาดทุนด้านเครดิต" [how much credit pain they are booking]
Home turf for me. Filter to BBL, KBANK, SCB, KTB, TTB and ask about ECL and provisioning. The system returns the passages where management gives the provision level with the bps attached:
SCB · FY2022 (Q2): "Given a high level of global uncertainty and economic headwinds from accelerating inflation, expected credit losses increased to Baht 10,250 million (175 bps of total loans) in 2Q22. Nonetheless, the Company expects to set aside provisions at not more than 145 bps for full year 2022."
— verbatim from SCB's (SCB X) MD&A · source file at the SEC
That passage is the whole case for reading the source yourself. It is not "provisions went up." It carries the level actually booked in the quarter (175 bps) and the ceiling management says the full year will not exceed (145 bps). Two different numbers, and the gap between them is what credit people watch. If you hold banks, this is an early warning that sweeps the entire group in one question. (The question set risk teams actually use is in 5 questions risk people ask of an MD&A)
⚠️ Read it correctly: the passages above are a report of what management wrote in a public document. They are not a view on the stock and not a claim that any company is in trouble — very strong companies write about risk too. The tool's job is getting you to that paragraph fast. The interpretation is yours.
6. Read the results on screen, then pull them into Excel (when the work continues)
Every result card carries the verbatim source text from the MD&A plus company · year · period · page number · the link to the 56-1 file as published by the SEC — and an Export Excel button that pulls the full ranked result set (up to 100 items) into a spreadsheet that opens in Excel directly. The columns you get:
| Column | What it is |
|---|---|
| Company | ticker |
| Year · period | fiscal year + quarter / full year |
| Page | page number in the source file |
| MD&A text (source) | the verbatim passage quoted |
| SEC link | URL of the source 56-1 file |
Export needs a paid pack (DELTA and up). As of 2 August 2026, export belongs to DELTA (฿799) and GAMMA (฿1,399). The free pack still uploads watchlists, searches, and reads results on screen as normal — it just cannot pull the full set out as a file. The reason is plain: free exists so you can test until you are convinced, not to be a data pipe. (Packs compared without the sales pitch in the pack selection guide)
One more thing to know up front: the free pack does not see as far back as the examples in section 5 (the FY2021–FY2023 cases above need a deeper pack). Free is built for checking the latest filings across your portfolio for a shift in tone, which is the question retail asks most often anyway. The day you want to walk one name back across several years, move up. (A multi-year read, worked through on PSL)
7. Why this used to be institutional-only
Three years ago, doing what section 5 just did — scanning the MD&A of 5 stocks at once, several quarters back — left you two options: open the PDFs one volume at a time all night, or run your own data team.
| Retail yesterday | The institutional side | Retail today | |
|---|---|---|---|
| Getting your list into the system | no system to put it in | a data engineer feeds the CSV into a pipeline | upload a CSV / paste the column out of Excel |
| Companies read at once | 1 (one file at a time) | the whole universe | up to 50 per question |
| Have to guess the exact wording | yes, and usually guess wrong | no (semantic) | no (semantic) |
| Can you check the source | yes, very slowly | yes, through internal systems | yes — every card has a page number + SEC link |
| Cost | an entire night | team salaries | 1 credit (portfolio ≤25 names) |
The right-hand column is what this article is handing over — not data you could not reach (these documents have always been free) but the cost of asking one question, down far enough that one retail investor does it alone.
8. For the people who would rather write the code themselves (B2B / quant)
Once the list runs past 50 names, or you want it running as a quarterly pipeline instead of clicking through a web page, that is what the tickers filter was designed for, over the REST API (in the beta plan for teams, quants and funds). The shape of it: read your coverage CSV, chunk it into 50s, fire the same question at every chunk, merge the results back into one Excel file.
# ตัวอย่างเชิงแนวคิด (API สำหรับทีม/องค์กร — แผน beta)
import csv, requests

BASE = "https://api.boomleverage.com/mdna/v1"   # base URL + key ได้รับตอนเปิด beta

# 1) โหลด coverage universe ของคุณจาก CSV (คอลัมน์แรก = ชื่อย่อหุ้น)
with open("my_coverage.csv", encoding="utf-8-sig") as f:
    universe = [row[0].strip().upper() for row in csv.reader(f) if row and row[0].strip()]
universe = [t for t in universe if t != "SYMBOL"]     # ตัดหัวคอลัมน์ทิ้ง

def chunks(xs, n=50):                                   # ตัดเป็นก้อนละ ≤50 (เพดานตัวกรอง)
    for i in range(0, len(xs), n):
        yield xs[i:i + n]

# 2) ยิงคำถามเดิมวนทุกก้อน แล้วรวมผล
rows = []
for batch in chunks(universe):
    resp = requests.post(
        f"{BASE}/query",
        headers={"X-Api-Key": "<YOUR_KEY>"},
        json={"query": "การตั้งสำรองหนี้เพิ่มขึ้น", "tickers": batch, "top_k": 50},
        timeout=30,
    ).json()
    for r in resp["results"]:
        rows.append([r["ticker"], r["fy"], r["period"],
                     r["snippet_verbatim"], r["source_url"]])   # verbatim + ลิงก์ 56-1

# 3) เขียนกลับเป็น CSV ให้เปิดใน Excel ได้ทันที
with open("mdna_scan.csv", "w", newline="", encoding="utf-8-sig") as f:
    w = csv.writer(f)
    w.writerow(["ticker", "ปี", "งวด", "ข้อความ MD&A (ต้นฉบับ)", "ลิงก์ SEC"])
    w.writerows(rows)
Read that again and note what it actually does: read names from a file → chunk them → fire the same question at every chunk → merge into a table. That is the entire job. That is what funds pay a data engineer a salary to write and maintain.
And it is exactly what happens when you hit "นำเข้าหุ้น (watchlist)" and throw your portfolio Excel in — the only difference being that I already wrote that part. You never meet requests, never need an API key, never fight an encoding to keep Thai from turning to mojibake. You type the question in Thai, about your own portfolio.
(Teams that genuinely need the API or seats: the product page or the Enterprise page)
9. Tonight's five-minute homework: scan your own portfolio before tomorrow's open
End this with an action, not a nod. It takes under five minutes, for real.
- Open the Boom Leverage Terminal → hit "นำเข้าหุ้น (watchlist)" → ดาวน์โหลดเทมเพลต [Download template] (
mdna-watchlist-template.csv) - Drop your holdings into the first column (or copy the column out of your existing portfolio file and paste it into the box — you do not even have to save a file)
- Upload it back, then type the risk that scares you most about your own portfolio in Thai, the way you would say it to a friend — "ต้นทุนขึ้นจนมาร์จิ้นโดนบีบ" [input costs repriced faster than they can pass through] · "ลูกค้ารายใหญ่หาย" [the anchor customer walks and the revenue line goes with it] · "หนี้เยอะจนดอกเบี้ยกิน" [leverage heavy enough that interest is eating the earnings] — whatever is sitting in the back of your head
- Read the paragraph management wrote themselves, then click through to the 56-1 source on at least one of them
Start free: 100 credits a day, no card. A portfolio of ≤25 names costs 1 credit per question — 100 questions a day at zero cost.
What comes back is not a "trading signal." It is the answer to a question retail almost never gets to ask: what did the management of the stocks I hold put in writing in an official document, and has their posture moved since last quarter? That is the real distance between following the news and running surveillance on your portfolio — and it is far shorter than you think.
This content is for education and sourced analysis. It is not investment advice or a solicitation to trade securities · Every passage quoted is a report of what management wrote in Form 56-1 (One Report), disclosed publicly through the SEC. Investment decisions are the investor's own responsibility · Team and institutional tiers (seats · Excel export · API): the Enterprise page or contact@boomleverage.com
Read next
Type the Theme, Not the Year: How to Ask AI About Thai Stocks So the Answer Comes From the Filings, Not From Your Question
Read more MD&ACtrl+F Doesn't Just Miss — It Finds the Wrong Thing, and on Some Files It Sees Nothing at All: Three Layers of Information Investors Lose in Thai Filings
Read more MD&AOne Red Flag Was Never Enough: I Counted 104,153 Lines Thai Companies Wrote About Themselves, and All Six Lenses Lit Together Only 9 Times
Read more